

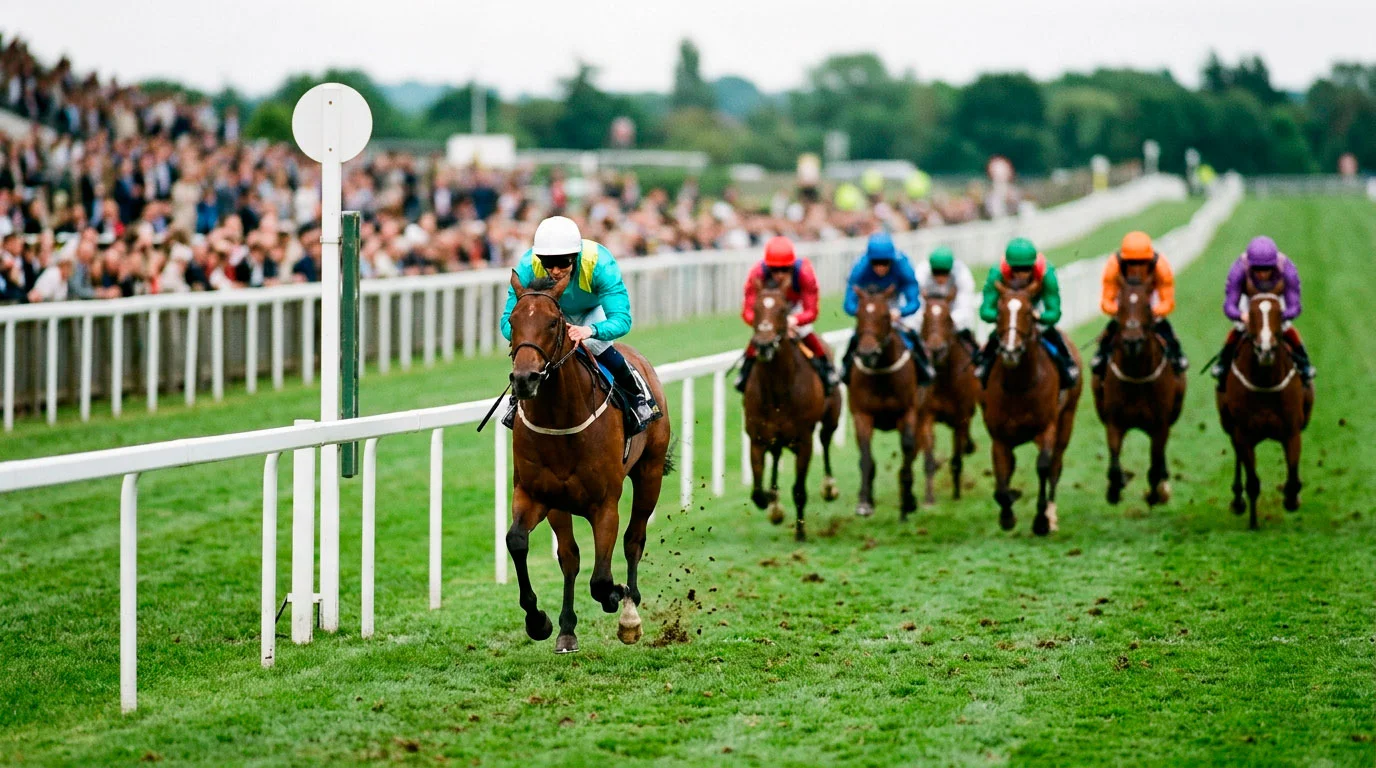
Why “just back favourites” is the worst advice in racing
Every punter who gets into horse racing is told the same thing at some point: “Just back favourites, they win the most.” It is technically true and commercially useless. Favourites win roughly a third of all UK races – specifically around 33% on the Flat – and that single number has kept more losing systems afloat than any other piece of racing data.
The problem is not the 33%. The problem is what it implies. A 33% strike rate on random favourites across random races produces a level-stakes loss, because the average favourite pays less than 2-1 to collect. Backing favourites is a mathematical loser unless you can pick which favourites are underpriced relative to their true chance. And that, it turns out, is a very different skill to noticing who is the favourite.
This piece takes the headline favourite numbers and tears them apart by code, price range and race type. By the end you should be able to look at any UK card and know, in about ten seconds, whether the favourite is in a range that rewards backing or in a range where value is almost always elsewhere.
Flat racing favourites
On British Flat racing across a large sample covering roughly two decades – 2002 through 2021 – favourites won almost exactly one in three races. The commonly cited range is 32 to 34%, with annual variation of a couple of percentage points but remarkable long-term stability. Second favourites win around 20%. Third favourites land between 12 and 15%. The rest of the field – every horse at fourth or longer in the market – splits the remaining 30-odd percent between them.
Inside that top three, the edges are interesting. Flat favourites of the board type – the horses that are clear, short favourites trading at 2-1 or shorter – tend to outperform the average strike rate because they are normally in fields where the class disparity is real. Favourites at 3-1 or longer in competitive handicaps tend to slightly underperform, because their status as favourite is more a reflection of the market’s view on a close race than of any actual class edge.
Field size also matters. In a five-runner Flat race the favourite is winning more like 45% of the time; in a sixteen-runner handicap the same horse, priced at the same 5-2 favourite, might be winning 20% of the time. The strike rate attaches to the market position, not to any property of the horse itself, and the distribution across field sizes is sharply non-linear. Punters who quote “favourites win a third of races” and act on it uniformly are treating fundamentally different races as if they were the same.
The Flat season in Britain runs March to November on turf, with all-weather filling the winter months, and the long-run strike rate averages across both surfaces hold up well. If anything, the favourite strike rate on all-weather racing is marginally higher than on turf, because the surface is more consistent and the form is more predictable. The gap is not enormous – a couple of percentage points – but it is measurable across a large sample.
National Hunt favourites
Jumps racing looks similar on the top line and different underneath. The headline favourite strike rate over jumps sits close to Flat’s 33%, but the mix of races where favourites win is structurally different. At the Cheltenham Festival in 2024, seven of twenty-one races were won by favourites – a 33% strike rate that happened to land on the average.
What that number hides is volatility. Some Festival years have seen favourites win over 40% of races; others have seen them win under 25%. The sample of twenty-one or twenty-eight races is too small to smooth variance, so a single Festival can skew headline perception in either direction. Over a full National Hunt season – roughly 4,000 races – the true strike rate reverts to the underlying figure in the low 30s.
The race-type split inside jumps is the practical lesson. Favourites in novice hurdles – where the field quality varies hugely and class edges are real – win at well above the season-wide average. Favourites in competitive handicap chases, where the handicapper has specifically designed the race to produce a close finish, win at well below it. The same animal might be favourite in both; the underlying chance is different.
Constitution Hill, Galopin Des Champs and a handful of other modern champions have distorted the headline numbers in their championship seasons, because horses like these win almost every race they contest and they contest big-field championship races where the favourite strike rate would otherwise be lower. Strip out the true champions and the open-race favourite strike rate in jumps is closer to 28 to 30% than the headline 33%.
Odds-on horses
This is where the received wisdom about backing favourites meets the actual numbers. Odds-on favourites in UK Flat racing – horses priced at less than even money, anywhere from 4-5 (1.8) down to 1-10 (1.1) – win 55 to 60% of the races they contest. Priced at 1.25 or shorter – essentially 1-4 or odds-on of 20% or more – they win 86% of the time.
Those numbers look extraordinary until you do the arithmetic. A 60% strike rate at an average price of, say, 4-6 (1.67), produces a level-stakes return of 60 × £1.67 = £100.20 for every £100 staked – effectively break even, give or take commission and bookmaker margin. A horse needs to be winning roughly that often to justify odds-on backing, and not every odds-on favourite is winning that often.
The 86% number at 1.25 and shorter is more comfortable. A horse priced at 1-4 (1.25) winning 86% of the time produces 86 × £1.25 = £107.50 per £100 staked, a modest 7.5% edge. That edge disappears fast if the bookmaker has priced a 1-4 horse that is actually only winning 80%. Odds-on backing is a game of millimetres, and the margin for error is almost zero.
The practical implication: odds-on horses are not free money. They are profitable only when the specific horse is outperforming the price it has been given. A 1-2 horse that should be 1-5 is a bet. A 1-2 horse that should be evens is a disaster. The 2025 Cheltenham Festival is a recent exhibit: seven odds-on favourites started, five of them lost. Five losses at short prices more than wipe out the wins. Punters who bet every odds-on Cheltenham favourite that year took a bath.
Second and third favourites
Second favourites across UK racing win 19.4% of races – 7,021 wins from 36,249 runs in a large sample – and show a level-stakes loss of around 11.8% when backed blindly. That is the structural mispricing in the market. Second favourites are slightly overbet relative to their true chance, probably because punters looking for “value” instinctively move one slot down from the headline favourite.
Third favourites and longer are more volatile but tend, in large samples, to be closer to fairly priced. The market’s overround is spread more evenly across the board as prices lengthen, and the 4-1 in a competitive handicap is typically closer to a true 4-1 than the 2-1 favourite in the same race is to a true 2-1. The inefficiency sits at the top of the market, not the bottom.
None of this tells you which second favourite to back. It tells you that a blind second-favourite strategy loses money at a rate slightly worse than random, so if you are backing second favourites you need a reason beyond market position. The reason needs to be horse-specific: why this particular second favourite is mispriced today, what the market has failed to weigh, which factor in the form justifies a price closer to the favourite.
Why blanket strategies lose
Every winter, newspaper supplements publish “follow the favourites” or “lay the favourites” or “back the second favourite in handicaps” systems. Every one of them loses money in the long run. The reason is structural: the market prices favourites accurately on average, and any blanket system that treats every race as equivalent will revert to the underlying market efficiency.
The market is not efficient, but it is efficient enough that simple rules do not beat it. Where value lives is in the cases where a specific race’s pricing diverges from a specific horse’s true chance, and spotting those cases requires doing the work race by race. There is no shortcut. If there were, the bookmakers would have priced it out by the end of the first month.
What the strike-rate numbers do tell you is where to focus effort. In races where the favourite is at even money or shorter with a genuine class edge, the strike rate is high enough to be a serious consideration. In competitive handicaps with favourites at 3-1 or longer, the favourite is more often worth opposing than backing at those prices. In jumps races with one standout champion, the favourite is the whole market and the trade is against the other horses. Knowing which category a race falls into – before you open the form – is the first useful filter the numbers give you.
The pillar on betting at horse racing places these strike-rate realities inside the wider map of how UK markets are priced and where value sits in the concessions bookmakers layer on top.
Articles
Published by the bettingathorseracing.com team.
